Visa Chart Components
@visa/scatter-plot
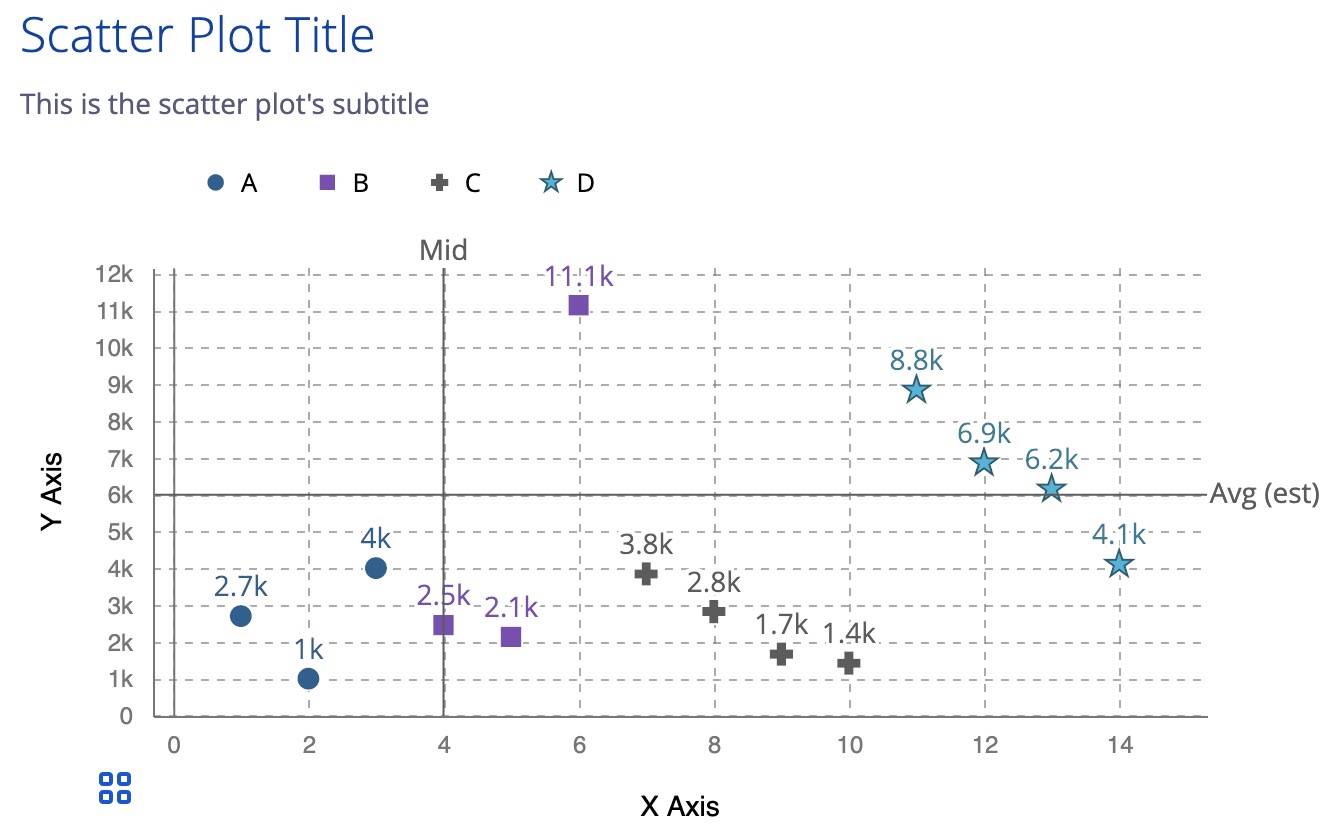
<scatter-plot
  accessibility = {...}
  data = {[{"item":1,"group":"A","value":2700},{data}]}
  xAccessor = {"item"}
  yAccessor = {"value"}
  groupAccessor = {"group"}
/>
Installation Steps
- Using NPM:
$ npm i @visa/scatter-plot
- Using Yarn:
$ yarn add @visa/scatter-plot
These materials are intended for illustrative purposes only. They should not be relied upon for marketing, legal, tax, financial, regulatory or other advice. Any links to third party sites are for your information only and do not constitute endorsement by or affiliation with Visa. Visa has no insight into and/or control over third party content and code and disclaims all liability for any such components. Visa Chart Components code snippets printed on this page are licensed under the MIT license.